Analytics tells you which city your visits came from. AllOverTheMap shows which street your participants were on.
Wix, Google Analytics, Instagram and YouTube count visits and followers and guess the city from the IP address. AllOverTheMap records only people who joined your class, live or event and chose to drop a pin, with GPS accuracy and each person’s local time.
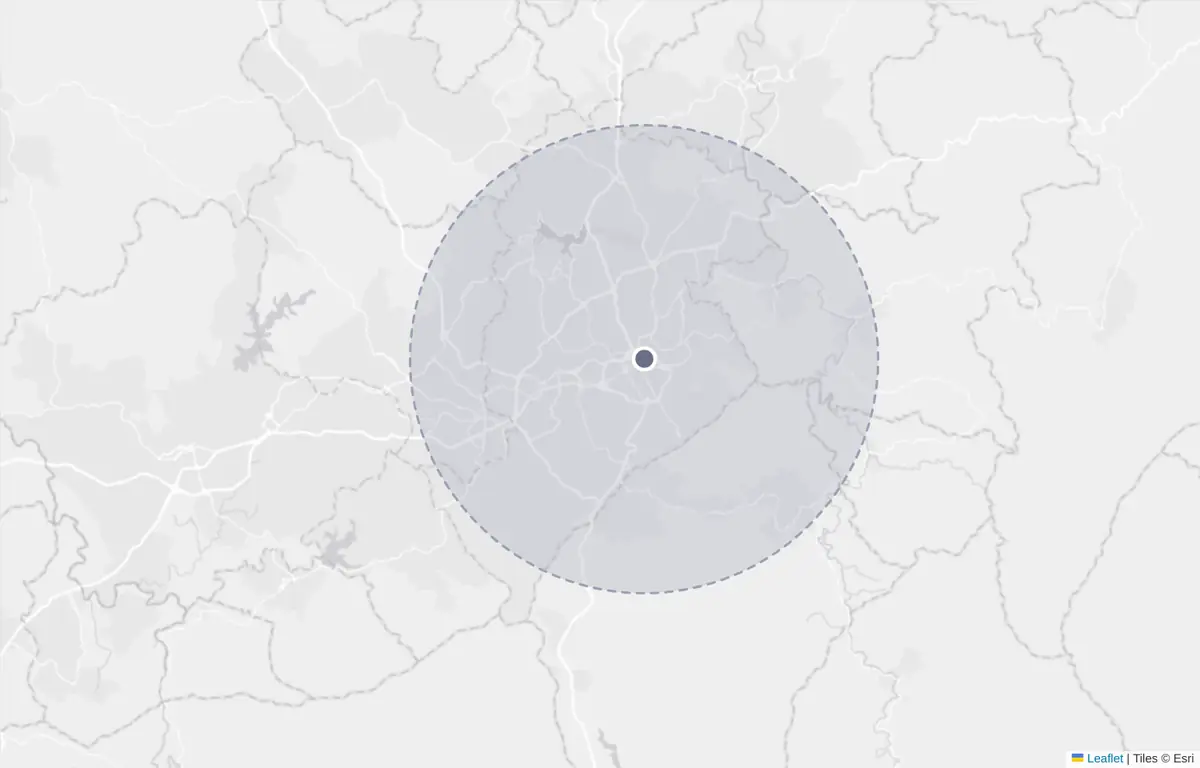
“Belo Horizonte — 86% of visits.” A blob about 15 km wide, estimated from IP addresses. It doesn’t tell you who attended or which neighborhood they were in.
How AllOverTheMap sees it
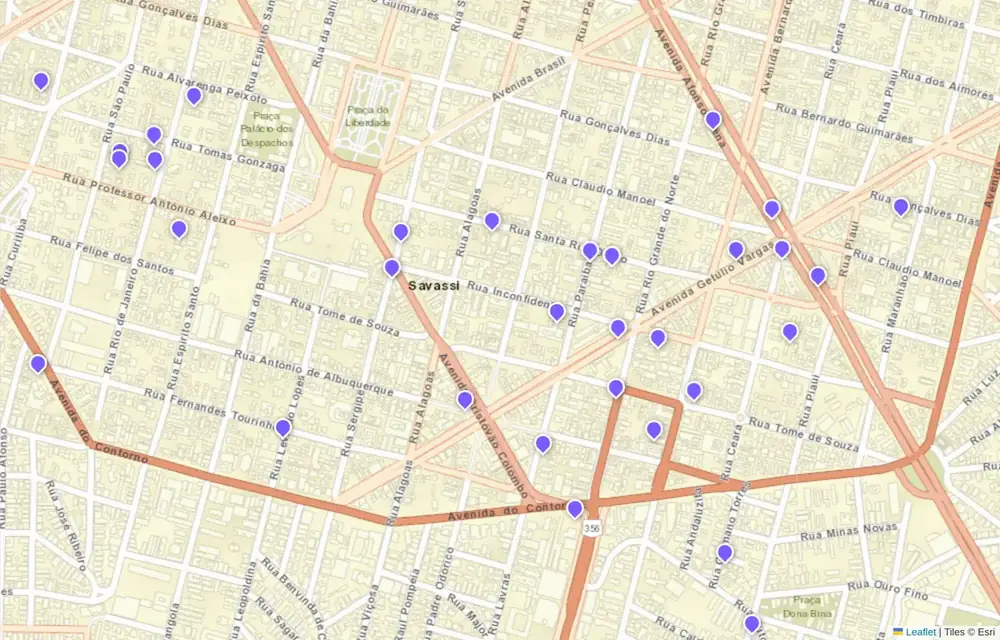
Savassi · 32 · GPS ±6–35 m
The same class, in the Savassi district: each pin is one participant, placed on the street where they were, accurate to a few meters.
Same class, two readings
A city gives you a report. A street gives you a decision.
The images on this page come from a demo scenario: a creator in Belo Horizonte, Brazil, with 4 live classes and 90 participants. The numbers are fictional, but this is exactly how your dashboard shows your data.
Live demo
Zoom down to the street. Then press play on a class.
Switch between the analytics view and the AllOverTheMap view, zoom down to the block, and watch participants arrive in the order they joined, with each person’s local time.
0participants
0districts and cities
0placed by GPS
local time
Side by side
What each tool can actually answer
Website & social analytics
AllOverTheMap
Who gets counted
Every visitor or follower, including people who leave after 3 seconds
Only people who joined your event and chose to drop a pin
Where the location comes from
Estimated from the IP address or a self-reported profile
Device GPS with the person’s permission, or a pin placed by hand
Finest scale
Country, state or city
Street and block, accurate to meters
Time
Daily totals in your account’s time zone
Each participant’s local time, weekday × hour and time zone
Scope
The whole website or profile
One map per class, live, cohort, event or campaign
Channels
Each platform with its own report
One link for Instagram, YouTube, email, WhatsApp and a QR code on stage
Data owner
The platform
You, with spreadsheet (CSV) export
Is it content?
No: it’s an internal report
Yes: the map filling up live becomes stories, reels and media-kit material
General comparison: each platform has its own features. IP geolocation usually gets the city right, but not the neighborhood or street, and it may point to the internet provider rather than the person.
Time is geographic too
Who arrives late, and from where.
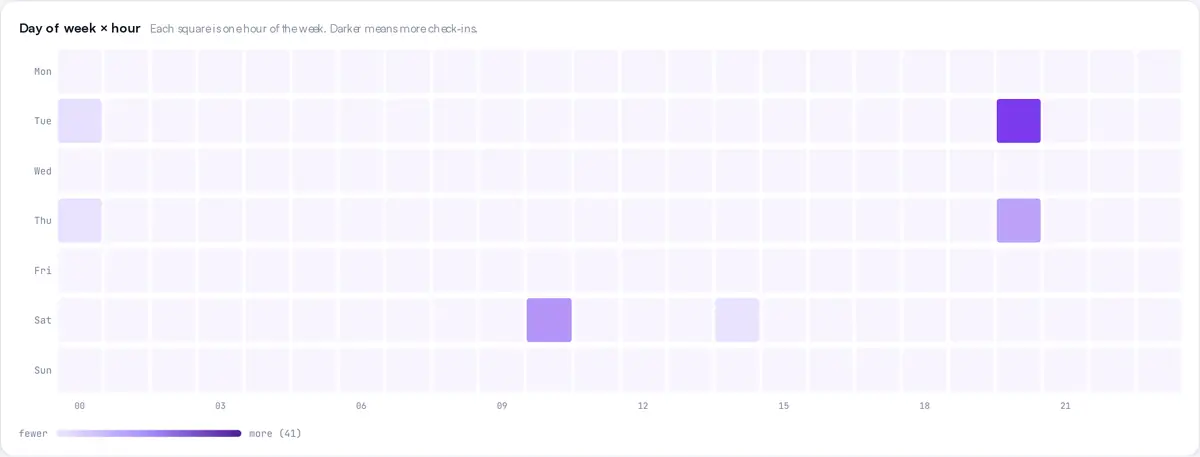
Each check-in keeps the local time of the person who dropped the pin. Cross time with place and the pattern shows up:
Pampulha, Barreiro and Contagem join 34 to 40 minutes after the 8 pm classes start, likely because of the evening commute.
At the Saturday 10 am class, those three districts bring twice as many participants per class.
In Lisbon, the 8 pm classes start after midnight local time. On Saturday the same people join at 2 pm.
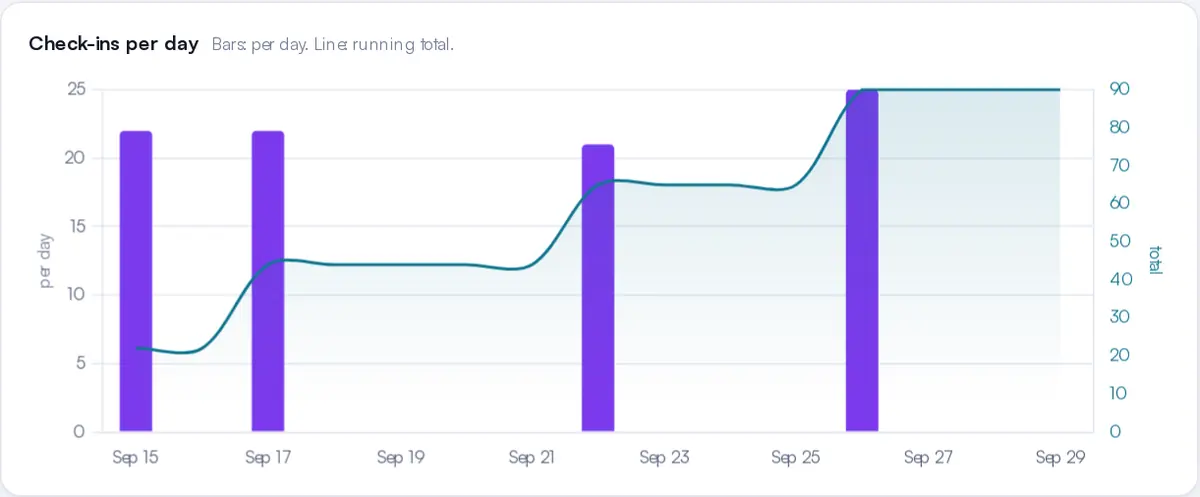
Weekday × hour: each square is one hour of the week, in the participant’s local time.Participants per day and running total for one cohort.
Where your audience is
The heatmap tells you where to meet in person.
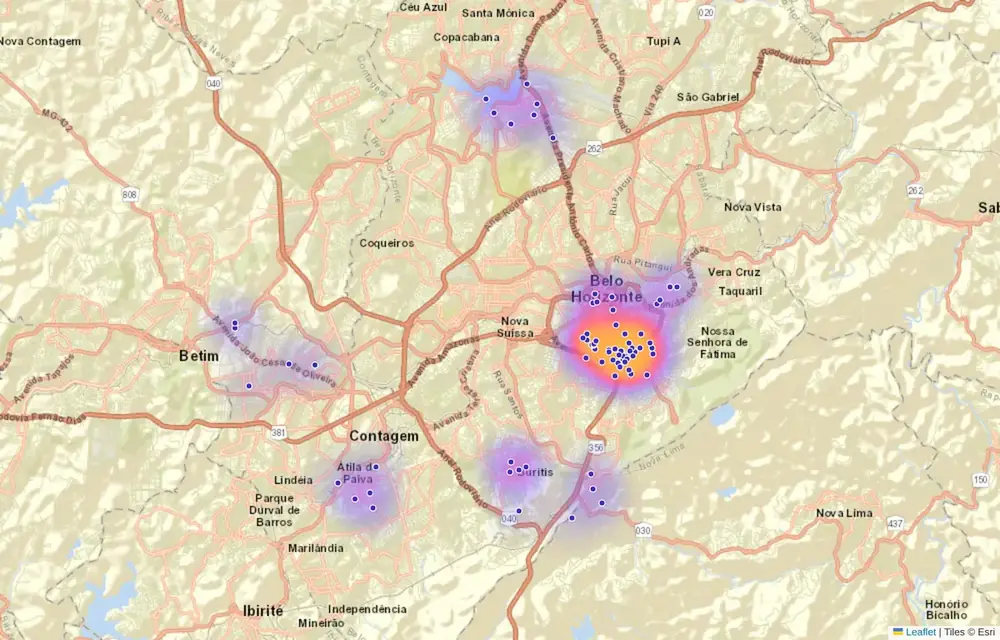
On the heatmap, 43 of the 90 participants (48%) were within 2 km of Savassi. An in-person workshop there is close to half the class. Pampulha and Contagem form their own clusters, good candidates for a second cohort or local ads.
Class heatmap across metro Belo Horizonte: clusters appear by neighborhood, not by city.
Decisions
What changes in practice
01
When to go live
If a region always arrives late, add another slot, a replay, or a lighter opening segment.
02
In-person events
Hold the workshop, meetup or pop-up where the pins cluster, not where followers supposedly are.
03
Geo-targeted ads
Spend in the neighborhoods and cities where engaged people already are, with a radius of a few kilometers.
04
Local sponsors
“48 participants within 2 km of your store at my last class”: proof that follower demographics can’t give.
05
Which channel brings real people
One map per channel or campaign: compare Instagram, YouTube, email and WhatsApp by what matters, participation.
06
Content
The map filling up live engages the room in the moment, then becomes stories, reels and a media-kit page.
Privacy
Only people who want to join are counted.
A location is recorded only when the person taps “allow” or places a pin on the map. It’s a single check-in: no continuous tracking, no app, no sign-up. Email and phone are optional and appear only in your private dashboard, never on the public map.
Your next event can have its map ready.
One exclusive map per event, a private dashboard with spatial and temporal analysis, and the participant list as a spreadsheet.
 Belo Horizonte · 86% · IP
 Savassi · 32 · GPS ±6–35 m